
As of yesterday, the NIFTY 500 index is just 4% below its all-time high. This should indicate a typical bull market.
But somehow, the market sentiment “feels” gloomy.
Generally, market data determines the sentiment. But sometimes you need to start with sentiment and then dig into the data.
So, we dug under the hood. We analyzed all Nifty 500 stocks to see how far each one is from its own all-time high.
- Only 8 stocks are at their all-time high.
- Only 8% stocks are down less than 5% from their all-time high.
- Meanwhile, nearly half of Nifty 500 stocks are down more than 30% from their all-time high
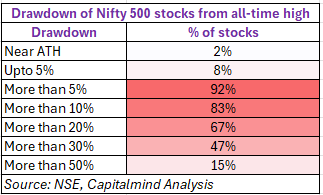
If over 66% of stocks are down 20% or more, how is the index down only 4%?
Because the Nifty 500 index is market cap (free float) weighted. Which means, not all companies have equal weight. A few large companies have an outsized influence on where the index goes.
When these big companies rise, they pull the index up. It does not matter if hundreds of smaller names are falling at the same time.
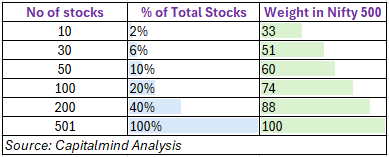
Here is the weight the top stocks have in the index (NIFTY 500):
- Only 10 stocks (2% of 500) carry 33% weight in the index
- Just 30 stocks, have 51% weight in the index
The composition of the index is creating an appearance of a bullish market while the constituents are struggling. If your portfolio does not hold these heavy weights, you are feeling the pain.
If it doesn’t feel like a bull market, that’s because for most stocks, it isn’t one.